Expected goals (xG) have become the most widely used metric in football analytics in the last decade. In short, xG models, such as the one developed by American Soccer Analysis, calculate how many goals a team should have scored based on the characteristics of the shots they have taken. Penalties provide the easiest example: roughly 76% of penalties are converted, so each penalty has an xG value of 0.76. Many articles have shown that using expected goals is preferred to actual goals when evaluating performance, because the metric is generally much more stable due to the rare nature of actual goals.
One of the limitations of xG is that the models do not take into account the player taking a shot. Not all players are created equal, meaning a shot taken by Hany Mukhtar, the 2022 MLS MVP, is more likely to end up in goal than a shot taken by let’s say, Nouhou Tolo, the legendary Sounders defender who isn’t particularly known for his finishing skills. However, a model that only takes into account a player’s past xG values, will predict the same amount of future goals for Mukhtar and Tolo in the unlikely but not impossible case both have produced similar shots in a given sample. And while it is proven that finishing is not necessarily a repeatable skill, it’s safe to say that if we want to predict future goals, adding shooting ability seems like a good idea.
In come PFF Shooting Grades. The PFF player grading system evaluates every player for every event during a game, including every shot. Each player is given a grade of -2.0 to +2.0 in 0.5 increments on a given play with 0 generally being the average or “expected” grade. The plus-minus grades, which involve manual scoring of each event by a human, are transformed into a 0-100 scale at a game and season level to make them more intuitive. For a detailed breakdown of how PFF player grades are calculated, read this article. The 2021 and 2022 leaderboards for shooting are given below (Mukhtar is the only player in the top-10 for both years, he currently ranks 12th for the ongoing 2023 season).
| MLS 2021 | |||
| Rank | Player | Team | PFF shooting grade |
| 1 | Damir Kreilach | Real Salt Lake | 91.9 |
| 2 | Ricardo Pepi | FC Dallas | 90.9 |
| 3 | Felipe Mora | Portland Timbers | 90.6 |
| 4 | Ola Kamara | D.C. United | 90.3 |
| 5 | Hany Mukhtar | Nashville SC | 90.1 |
| 6 | Johnny Russell | Sporting Kansas City | 89.0 |
| 7 | Chicharito | LA Galaxy | 88.8 |
| 8 | Daniel Salloi | Sporting Kansas City | 87.6 |
| 9 | Diego Fagúndez | Austin FC | 86.6 |
| 10 | Daryl Dike | Orlando City SC | 86.3 |
| MLS 2022 | |||
| Rank | Player | Team | PFF Shooting Grade |
| 1 | Hany Mukhtar | Nashville SC | 99.2 |
| 2 | Lewis Morgan | New York Red Bulls | 91.5 |
| 3 | Daniel Gazdag | Philadelphia Union | 90.2 |
| 4 | Dejan Joveljic | LA Galaxy | 88.5 |
| 5 | Jesús Ferreira | FC Dallas | 88.0 |
| 6 | Sebastián Driussi | Austin FC | 87.7 |
| 7 | Thiago Almada | Atlanta United | 87.4 |
| 8 | Gonzalo Higuaín | Inter Miami CF | 87.1 |
| 9 | Carlos Vela | Los Angeles FC | 86.7 |
| 10 | Mikael Uhre | Philadelphia Union | 85.5 |
So let’s try to build a model. Before we start, we are not expecting miracles here. Predicting football games is harder than predicting the stock market, so we are bound to find out that we are still missing a lot of information that influences future goalscoring.
We’ll start with using stats from the previous 5 games to predict the number of goals scored in the next 5 games. Goalkeepers are excluded from the dataset, obviously. We combine data from ASA, which is easily retrieved through their API, with PFF data and focus our attention on the 2021 and 2022 seasons in MLS. The idea is simple: future goalscoring depends on both being able to get yourself into scoring position (measured by xG) as well as being able to shoot the ball (measured by PFF Shooting Grades).
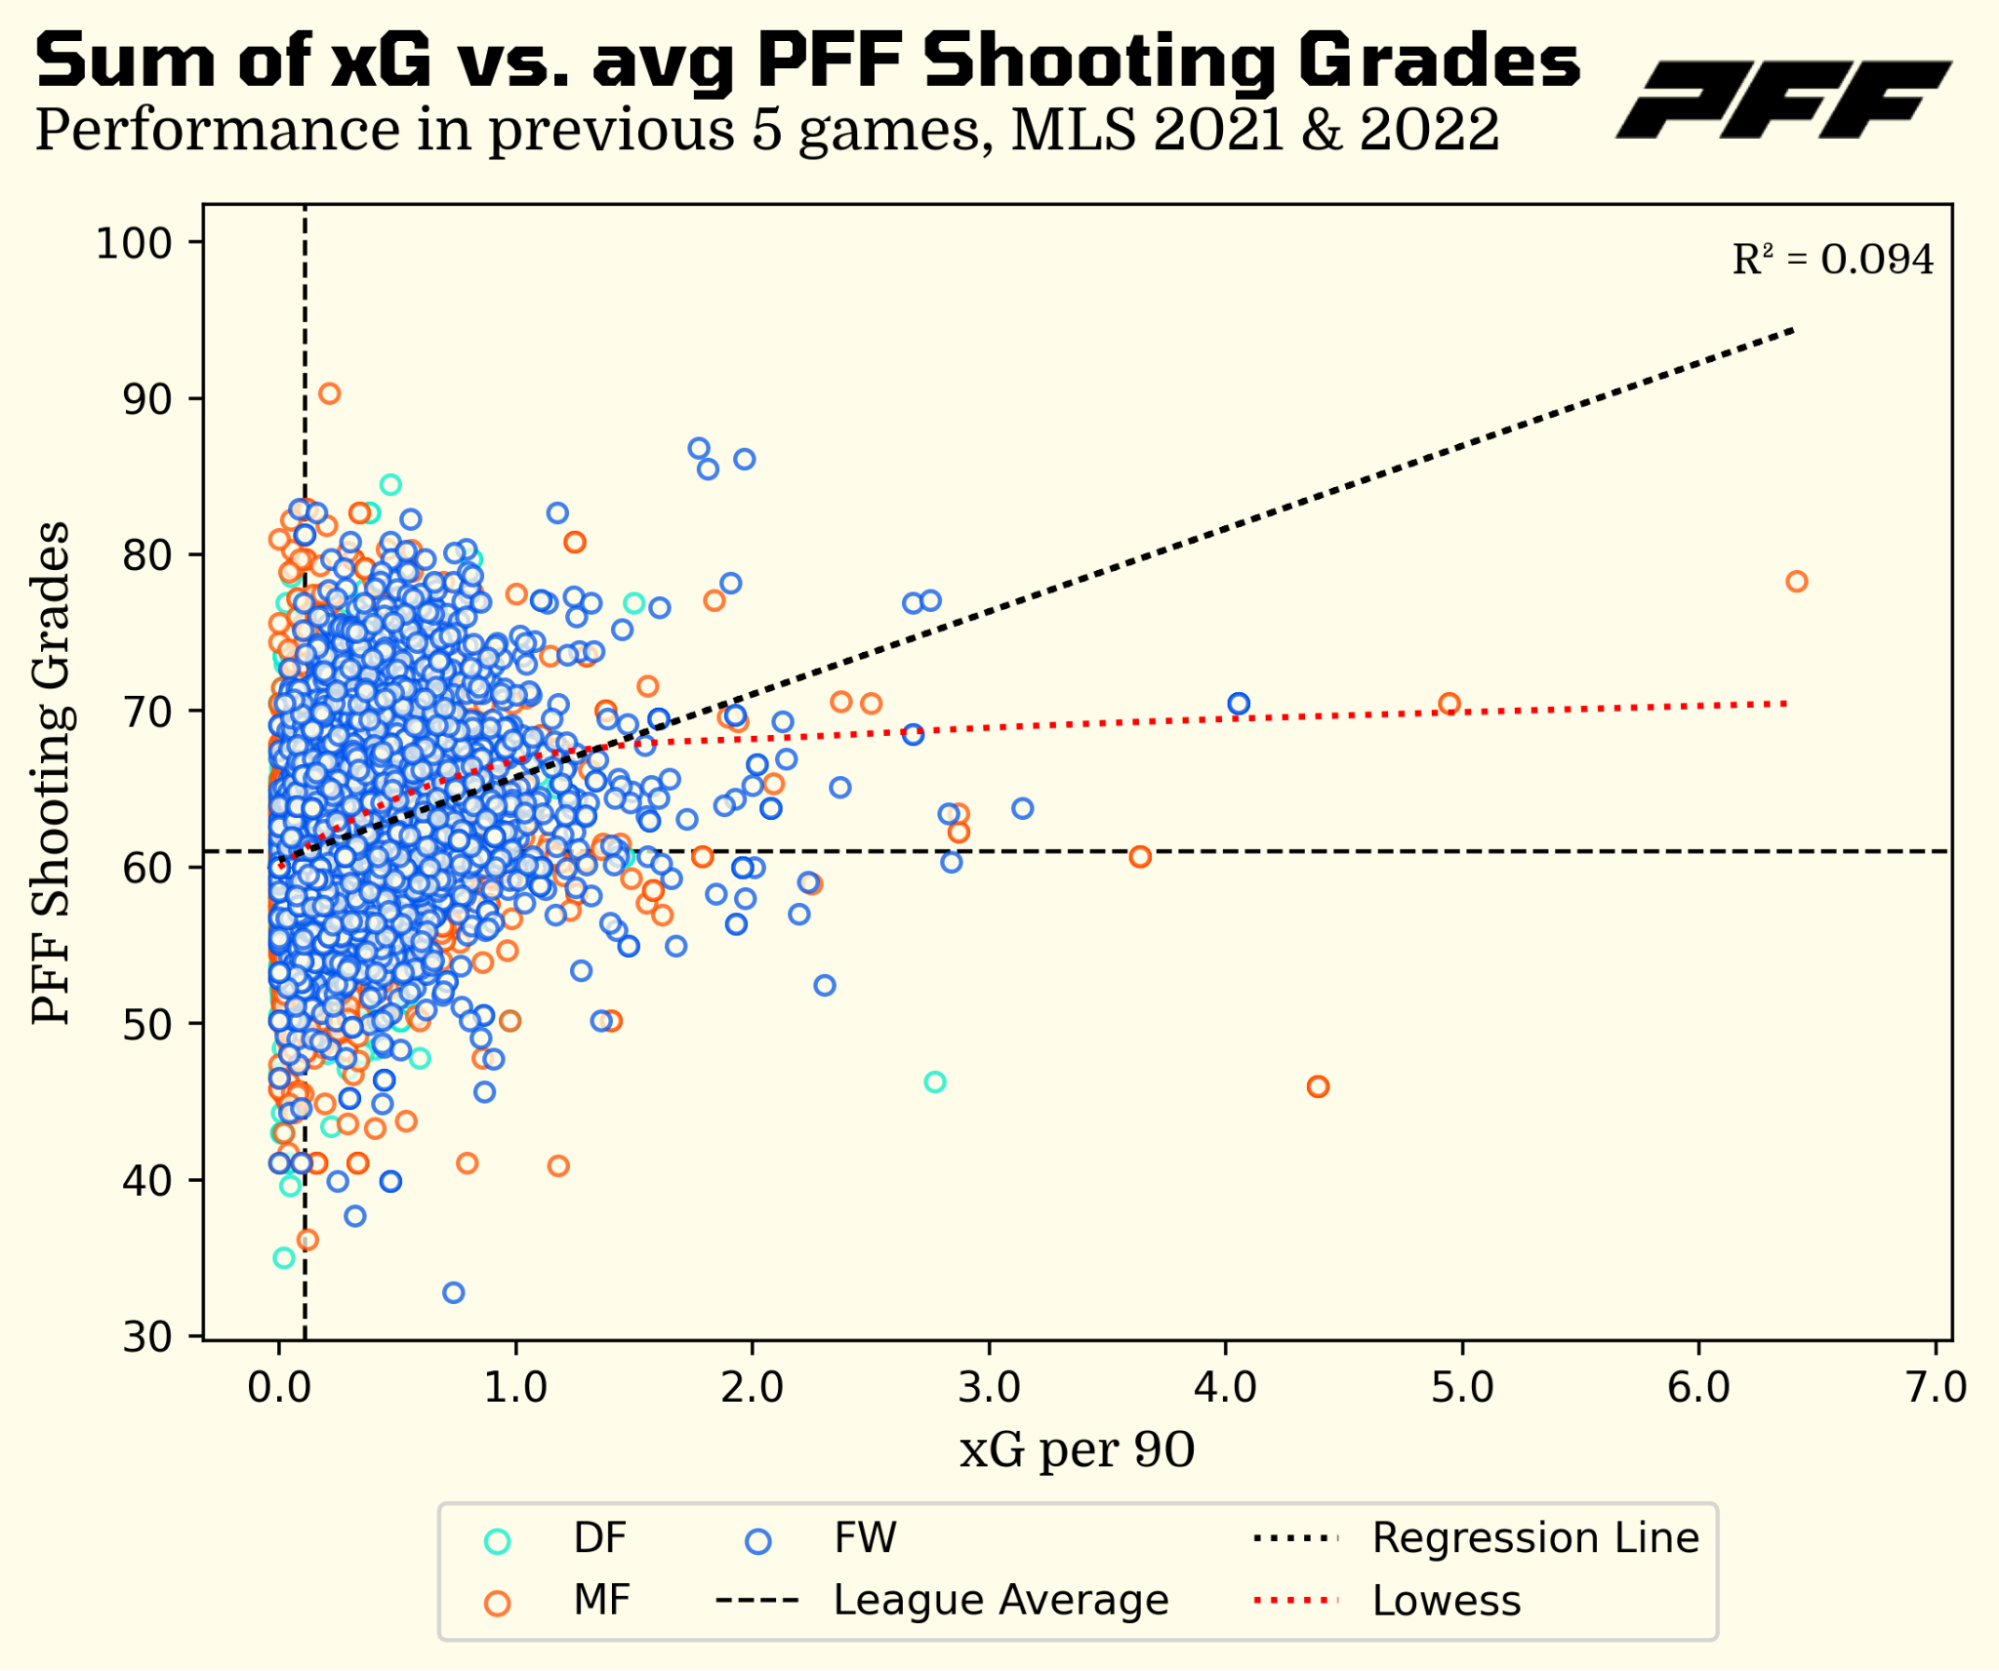
First we need to make sure that xG and PFF Shooting Grades are not measuring the same thing. In the plot below, we see a small linear relationship between the sum of xG and the average PFF Shooting Grades in the previous 5 games. However, LOWESS suggests that outliers are playing a role: for xG totals north of 1.0, there seems to be no relationship between the two, while there is still plenty of variation left in PFF Shooting Grades for xG totals below 1.0, which implies that both are two independent measures. But how much do they contribute to goalscoring?
Now that we’ve gotten that out of the way, let’s look at some simple OLS models. The table below shows the R-squared, F-statistic and Akaike Information Criterion (AIC) for some. The results confirm that a model with xG per 90 outperforms one with goals per 90 as a single explanatory variable. It also shows that xG per 90 is a better predictor of future goals than the PFF Shooting Grades alone. However, combining variables is the way to go and as it turns out, combining xG per 90 with the PFF Shooting Grades improves the performance of the model, while adding goals per 90 as a third explanatory variable brings little extra to the table.
|
Included variables |
R-squared | F-statistic |
AIC |
| Goals per 90 | 0.053 | 1874.9 | 75011 |
| xG per 90 | 0.073 | 2673.8 | 74262 |
| Avg. PFF Shooting Grades | 0.059 | 2130.2 | 74769 |
| Goals per 90 & xG per 90 | 0.080 | 1475.7 | 74008 |
| Goals per 90 & Avg. PFF Shooting Grades | 0.075 | 1371.4 | 74200 |
| xG per 90 & Avg. PFF Shooting Grades | 0.102 | 1926.1 | 73189 |
| All 3 variables | 0.103 | 1287.2 | 73183 |
If we take the last model and multiply the coefficient of each variable by its standard deviation in our sample, we get an absolute impact value, representing the variable's contribution to the prediction. Normalizing the impact values by dividing them by the sum of all impacts allows for a measure of each variable's importance relative to each other. In our case, xG per 90 demonstrates the highest impact (51.9%), followed by PFF Shooting Grades (42.9%), and goals per 90 (5.2%).
As a side note, changing the number of games (using the previous X games to predict the number of goals scored in the next X games) has the expected effect: including more games leads to better predictions at first, the AIC increase from including 5 games to including 10 games indicates that including an additional 5 games in the model does not lead to a significant improvement in the model's fit to the data, and the extra complexity introduced by the additional parameters outweighs any potential benefits. Below are OLS outputs for models that include all three variables:
| No. of games included | Observations | R-squared | F-statistic | AIC |
| 1 | 29962 | 0.017 | 256.7 | 14661 |
| 3 | 33672 | 0.057 | 1012.3 | 54054 |
| 5 | 33744 | 0.103 | 1926.1 | 73189 |
| 10 | 30446 | 0.137 | 2413.8 | 91487 |
| 15 | 25190 | 0.127 | 1223.6 | 84689 |
But our dataset doesn’t necessarily lend itself to OLS. Not only is our dependent variable ordinal, our sample is also flooded with players taking a very limited number of shots. Knowing this, a Random Forest model is a better choice. We include goals per 90, xG per 90 and the average PFF Shooting Grades over the past 5 games to predict the number of goals a player will score in the next 5. It leads to an R-squared value of 0.115, which easily beats the values obtained when considering each variable individually.
Our Random Forest model also gives us an opportunity to compare feature importances. Again, xG per 90 wins the race (50.1%), followed by a somewhat different distribution than we saw earlier between PFF Shooting Grades (30.2%), and goals per 90 (19.7%). Per position, the feature importances vary: the number of predicted future goals depends more on previous xG per 90 for defenders and midfielders, while actual goals per 90 come into play more for forwards. However, the importance of shooting ability is relatively stable for all.
| Goals per-90 | xG per-90 | PFF shooting Grades | |
| Defenders | 8.6% | 57.1% | 34.4% |
| Midfielders | 18.9% | 47.1% | 34.0% |
| Forwards | 32.0% | 35.4% | 32.6% |
So both OLS and Random Forest confirm what we were expecting: predictions of future goalscoring are improved by adding information about shooting ability that isn’t captured in xG models. This makes a ton of sense and is in line with Ben Tovarney’s findings here, with the key difference that he did not have the PFF Shooting Grades at his disposal. Obviously, the predictions can be improved by including other relevant variables or by using more sophisticated methods, for example by incorporating team strengths into the mix, but we found what we were looking for: evidence that adding a measure of shooting ability improves our predictions of future goalscoring.
Lastly, if we want to use our Random Forest model to predict who will score most goals in the next 5 games, it is important to add some features that we know will improve our predictions. For example, if we don’t include playing time during the previous 5 games as a feature, subs who happened to be successful in limited playing time will get too much credit for their inflated per 90 stats. Furthermore, we know positions play a role, so let’s add in the primary position of a player as well. The R-squared increases to 0.272, which is nice, and the feature importances are as expected (strikers are the most important when in comes to goalscoring):
| Feature | Importance |
| xG per 90 | 35.6% |
| Sum of minutes | 25.0% |
| Avg. PFF Shooting Grades | 20.9% |
| Goals per 90 | 11.2% |
| Position: ST | 3.8% |
| Position: W | 1.1% |
| Position: AM | 1.0% |
| Position: CB | 0.4% |
| Position: CM | 0.4% |
| Position: DM | 0.4% |
| Position: FB | 0.3% |
So without further ado, we present the players who are predicted to score the most in the next 5 games:
| Player | Team | Predicted Goals |
| Ryan Gauld | Vancouver Whitecaps | 2.47 |
| Teal Bunbury | Nashville SC | 2.32 |
| Carles Gil | New England Revolution | 2.30 |
| Julián Carranza | Philadelphia Union | 2.08 |
| Cucho Hernández | Columbus Crew | 1.97 |
| Alan Pulido | Sporting Kansas City | 1.92 |
| Evander | Portland Timbers | 1.84 |
| Josef Martínez | Inter Miami CF | 1.82 |
| Brandon Vázquez | FC Cincinnati | 1.81 |
| Daniel Gazdag | Philadelphia Union | 1.77 |
| Christian Benteke | D.C. United | 1.75 |
| C.J. Sapong | Toronto FC | 1.67 |
| Thiago Almada | Atlanta United | 1.65 |
| Luciano Acosta | FC Cincinnati | 1.64 |
| Hany Mukhtar | Nashville SC | 1.62 |